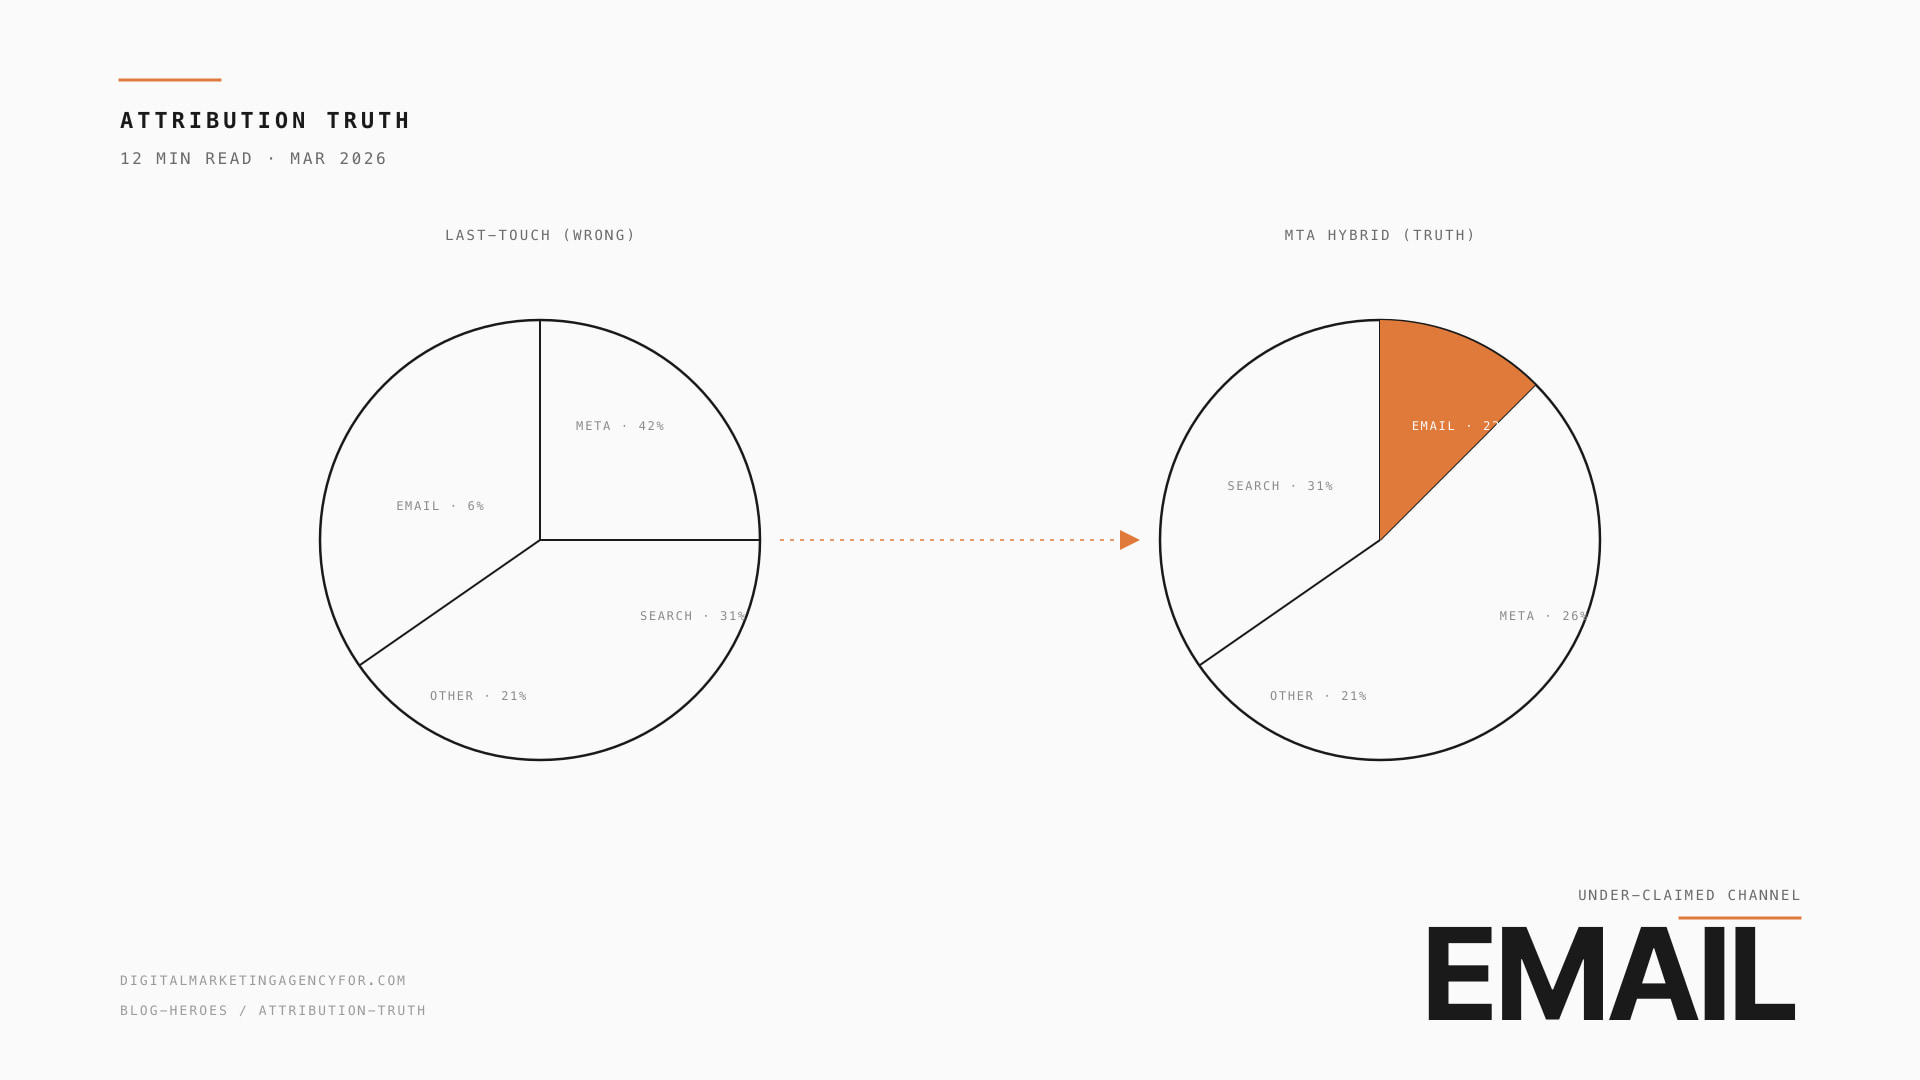
Why last-touch lies
Last-touch attribution credits the channel that delivered the final click. It’s clean, simple, and wrong. The buyer who became a customer last week didn’t only see your Meta ad — they read your email three weeks ago, searched the brand on Google after a TikTok video, browsed your blog, then clicked a Meta retargeting ad.
Last-touch attributes the conversion entirely to that retargeting click. It under-claims email, over-claims paid social retargeting, and gives you a wrong picture of which channels deserve more budget.
The four attribution models
Most marketing dashboards offer four:
- Last-click — credits the final click. Default in most tools. Simple, biased toward retargeting.
- First-click — credits the first touch. Biased toward awareness channels.
- Linear — splits credit evenly across all touches. Pretends all touches are equal; they’re not.
- Time-decay — weights recent touches more. Reasonable middle-ground; still arbitrary.
None of these answer the question that actually matters: “if I cut spend on channel X, how much revenue do I lose?” That’s the incrementality question, and it requires a different toolkit.
Meta’s pixel-based attribution credits every conversion the user touches across a 7-day click + 1-day view window. If a customer was already going to buy — they searched the brand, came to the site, browsed — but they happened to click a retargeting ad in the meantime, Meta claims the conversion.
For most DTC brands we audit, Meta’s self-reported revenue is 1.4–1.8× the GeoLift-measured incremental revenue. Same brand, same period, same data — just using ground-truth incrementality instead of last-touch.
Where email under-claims
Email’s last-touch revenue is typically the open → click → buy in one session. But email also drives massive amounts of branded search, direct revisits, and “I’ll think about it” buyers who eventually convert via paid retargeting.
Apply a 1.4× attribution multiplier on email and the rest of the dashboard suddenly makes sense — email’s contribution becomes visible, paid social’s claimed contribution shrinks toward truth.
GeoLift as ground truth
GeoLift testing turns off paid spend in a matched holdout region for a defined period. Compare conversions in the holdout vs the matched control region. The delta is the channel’s incremental contribution.
It’s expensive — you give up real spend in a real region — but it’s the closest thing to ground truth in marketing measurement. For brands at $1M+/mo paid spend, it’s the only honest way to calibrate the attribution model.
MTA hybrid in practice
The practical compromise for brands without GeoLift budget is MTA hybrid: a multi-touch attribution model calibrated against GeoLift findings or, more commonly, against industry-typical bias coefficients.
The coefficients we apply (rough rule-of-thumb across our DTC audits):
- Email / lifecycle: ×1.4 — under-claimed by last-touch
- SEO / organic: ×1.25 — under-claimed
- Google Search: ×0.85 — slightly over-claimed (brand cannibalisation)
- LinkedIn: ×0.85 — slightly over-claimed for B2B
- Meta Ads: ×0.65 — significantly over-claimed
- TikTok: ×0.7 — moderately over-claimed
These are not universal — they shift by category, by spend mix, by funnel depth. But they’re a reasonable starting point until GeoLift validation is available.
When to upgrade to MMM
Marketing Mix Modeling becomes worth the investment around $5M+ annual ad spend or when offline channels (TV, OOH, sponsorships) represent a significant share. Below that, MTA hybrid is the right tool.
If you’re guessing channel mix today and your team can articulate why your dashboard numbers feel wrong — that’s the signal that an attribution rebuild has the highest decision-quality return on any analytics investment.